

 China’s central bank is back in action, cutting interest rates and lowering reserve requirements to boost its economy. Well, guess what? Metals are feeling it, big time. Gold prices hit a record high, and copper and silver prices saw huge surges due to high demand.
As a trader scanning the market for opportunities, you’re probably wondering how these metals are trending and if there are any clear signs they’re still worth buying—or if the ship has already sailed.
What’s the Short-Term vs. Long-Term Sentiment on These Metals?
We can’t know exactly what short-term and long-term are doing with regard to these metals. Still, we can gauge their sentiment using a technical analysis proxy: the Guppy Multiple Moving Average. In short, there are two ribbon MA groups in this indicator:
- The short-term group (red MA ribbons) consists of six exponential moving averages (EMAs) with periods of 3, 5, 8, 10, 12, and 15, reflecting the sentiment of short-term traders.
- The long-term group (blue MA ribbon) has six EMAs, with periods of 30, 35, 40, 45, 50, and 60, representing the sentiment of long-term investors.
We will use a corresponding ETF as the proxy for each metal.
SPDR Gold Shares (GLD)
Let’s bring up this daily 6-month chart of GLD (you can also click the chart image below).
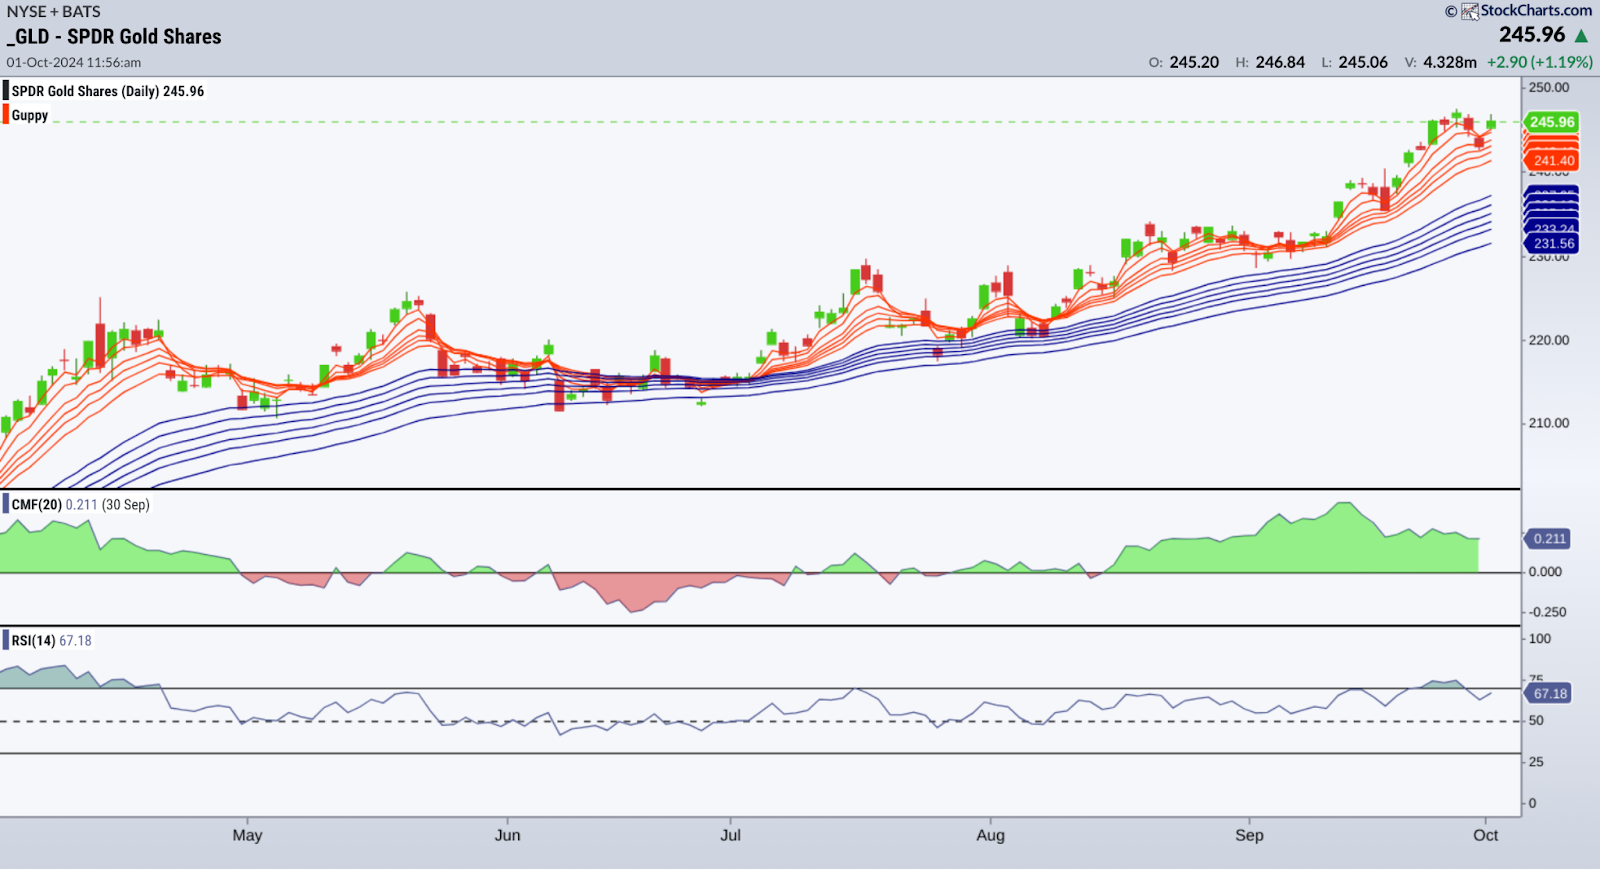
CHART 1. DAILY CHART OF GLD. Trending strong, but is it overbought?Chart Source: StockChartsACP. For educational purposes.
GLD is in record-high territory, and its next move will depend on a mix of global economic and geopolitical trends (meaning it’s anyone’s guess). But the GMMA technicals provide a narrative to follow:
- The ribbons are well spread apart, indicating that the current uptrend is very strong.
- The Chaikin Money Flow’s (CMF) slight decrease and Relative Strength Index’s (RSI) decline from “overbought” territory hints at a pullback, though it’s still too early to tell.
- When GLD eventually pulls back, expect the longer-term (blue) ribbon to act as a support zone. A close below it could trigger traders to sell, while a bounce off the bottom of the ribbon is usually seen as a buy signal.
iShares Silver Trust (SLV)
As gold prices continue to soar, silver presents a slightly different picture. Let’s shift to a 9-month daily chart of our silver proxy, iShares Silver Trust (SLV).
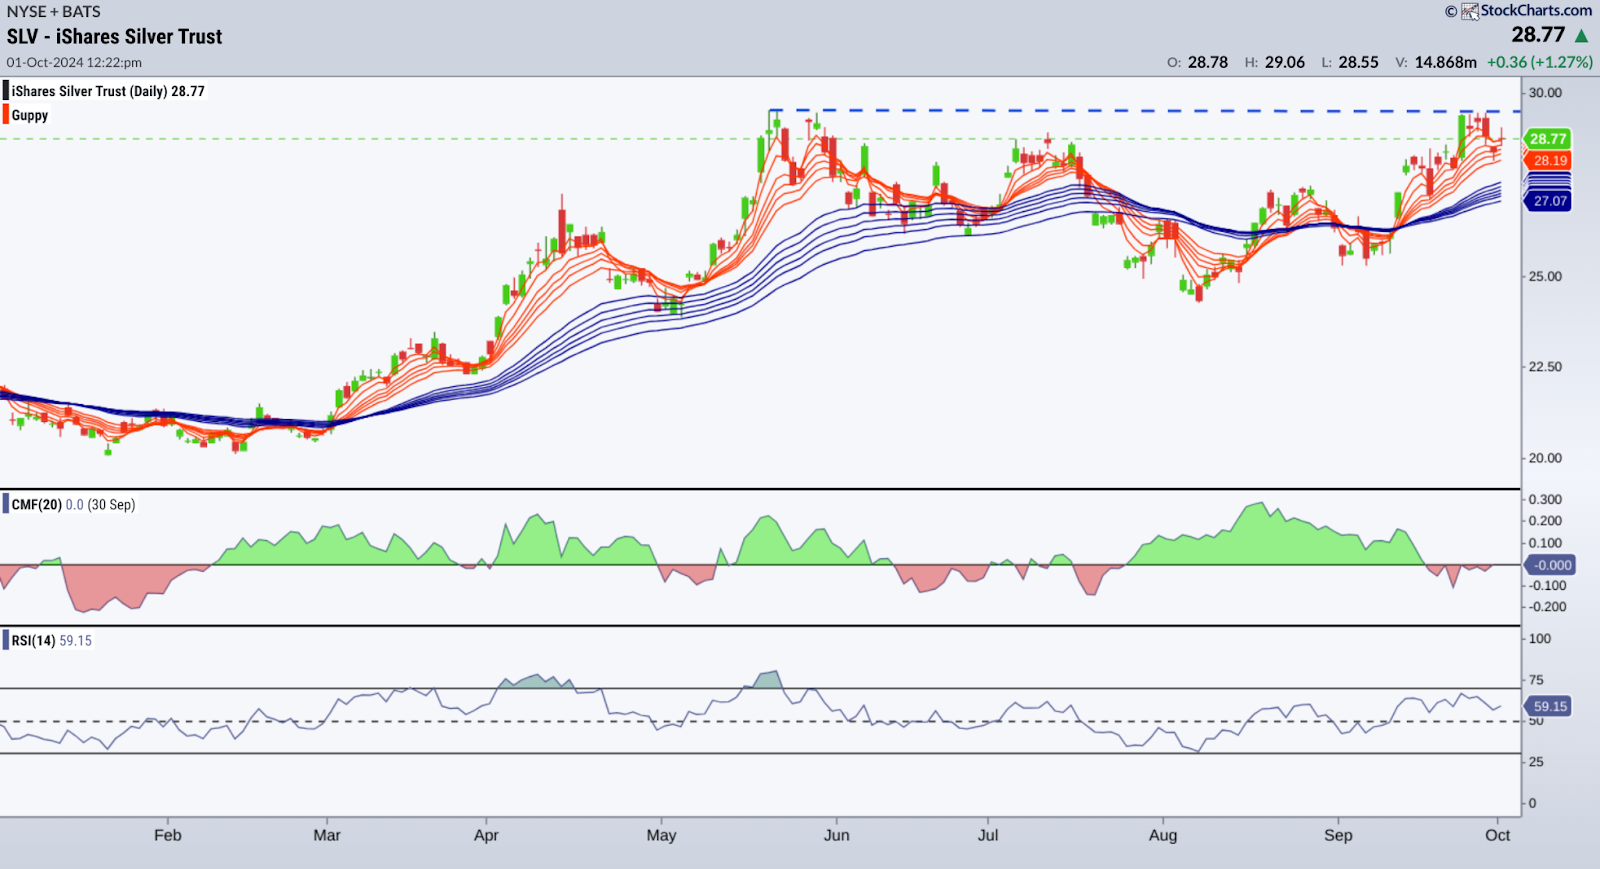
CHART 2. DAILY CHART OF SLV. A little toppy, or will we see a breakout?Chart Source: StockChartsACP. For educational purposes.
With resistance at around $29.60 (see blue dotted line), SLV looks a little “toppy ” while hinting at a bullish breakout.
- The CMF is in the negative, telling us that selling pressure has taken over and that SLV might not have enough momentum to break through the ceiling.
- The RSI, on the other hand, indicates that SLV still has some room to run, although it does show a slight divergence when comparing the current high and May high against the RSI’s corresponding high points.
- The GMMA paints a picture of a strong near-term surge, but, given the sideways consolidation near the top, it’s secondary to the actual pattern taking place (either a top or a breakout).
So, basically, it’s a wait-and-see moment for the white metal. But if it does break out, expect resistance (and possible price targets at the following highs), as shown in the monthly chart below.
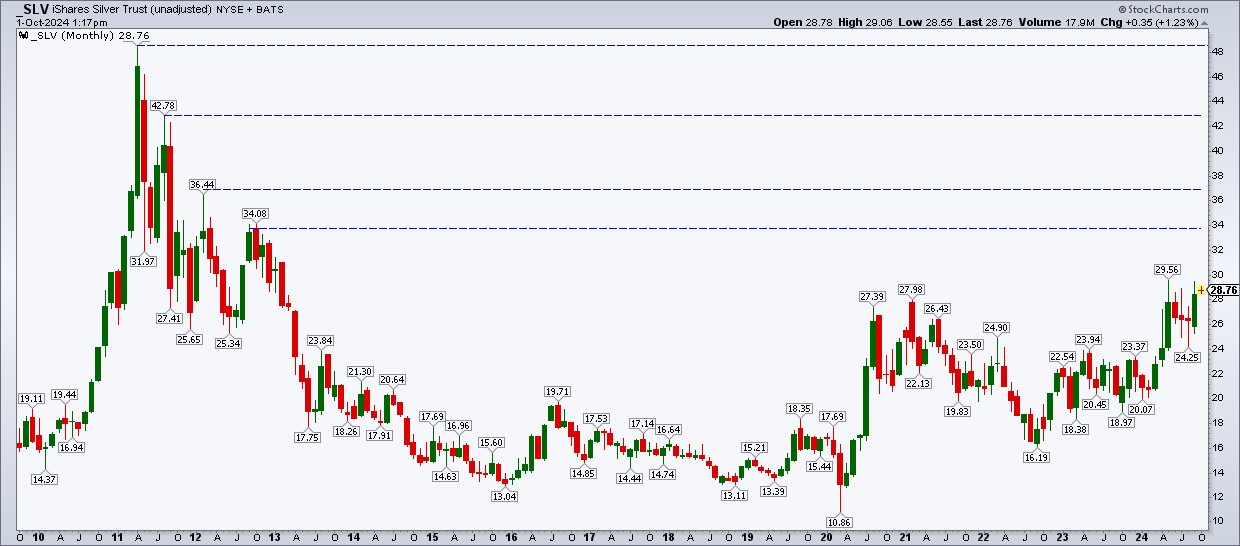
CHART 3. MONTHLY CHART OF SLV. Note the blue lines illustrating expected resistance levels should SLV break above current resistance.Chart Source: StockChartsACP. For educational purposes.
Expect resistance at:
- $34.08 – September 2012
- $36.44 – February 2012
- $42.78 – August 2011
- $48.35 – All-time high April 2011
United States Copper Fund (CPER)
Looking at the daily chart below, there was a breakout above $28.80. The question is whether it will follow through.
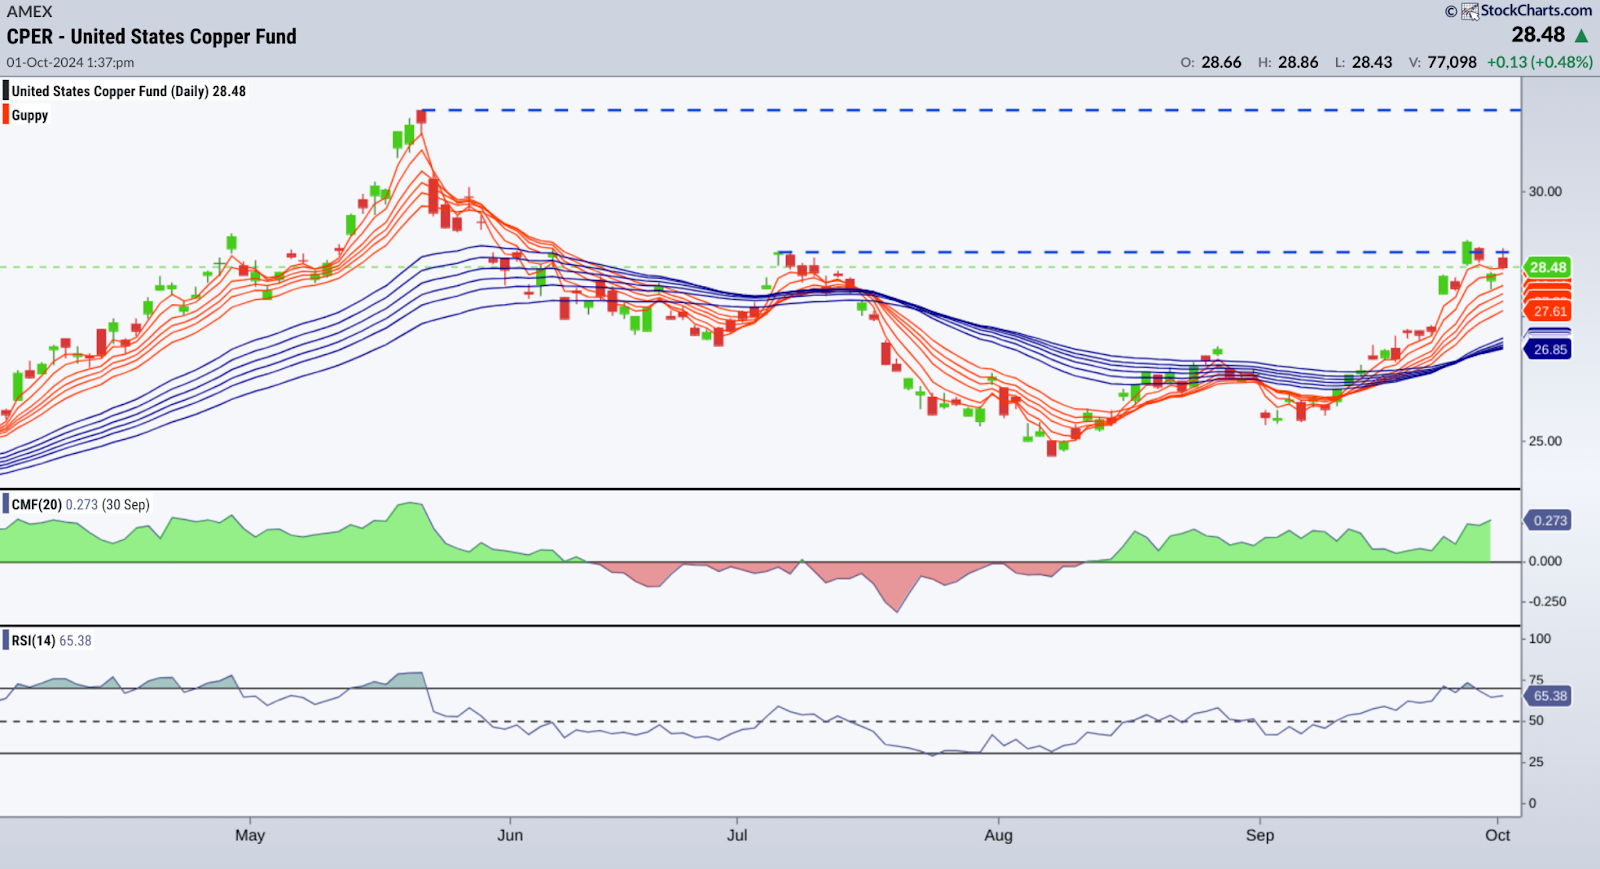
CHART 4. DAILY CHART OF CPER. A rapid surge leading to a breakout?Chart Source: StockChartsACP. For educational purposes.
The CMF shows a strong and continuing surge in buying pressure. The RSI just dipped from the 70 line, not quite in overbought territory.
Looking at the GMMA ribbons, note the suddenness and strength of the short-term ribbon against a “compressed” long-term ribbon. Besides indicating bullishness, what’s remarkable is the speed at which shorter-term traders piled in, pushing prices higher to the current breakout.
Given the momentum fueling the current surge, a follow-through is likely, with the next level of resistance at its all-time high of $31.63. If you entered (or are looking to enter) a long position, look to the bottom of the long-term ribbon to set a stop loss.
At the Close
As China’s latest stimulus shakes up the metals market, keep an eye on sentiment (via GMMA proxy) to gauge which metal may be surging ahead or losing steam. Gold prices look like they might surge ahead, perhaps after a breather. Silver’s price is at a crossroads, while copper is hinting at more upside, possibly reaching, if not challenging, its all-time high. It’s worth adding the three charts discussed in this article to your ChartLists.

Disclaimer: This blog is for educational purposes only and should not be construed as financial advice. The ideas and strategies should never be used without first assessing your own personal and financial situation or without consulting a financial professional.