


Ethereum is still under pressure from the EMA 200 today
- The price of Ethereum continues to move sideways today
Ethereum chart analysis
The price of Ethereum continues to move sideways today. This morning, we saw a bullish attempt that was stopped at the $2470 level. We had additional pressure in that zone in the EMA 200 moving average. The price failed to hold above, which had the effect of triggering a pullback to the $2430 level.
As Ethereum falls below the daily open price, it confirms the presence of bearish pressure. The next step is to observe a further pullback and a visit to this week’s support zone at $2400. This would mark our third test of that zone, and there’s a possibility of a breakout below and a drop to a new weekly low. Potential lower targets are $2380 and $2360 levels. Last week’s low price was at $2308 level.
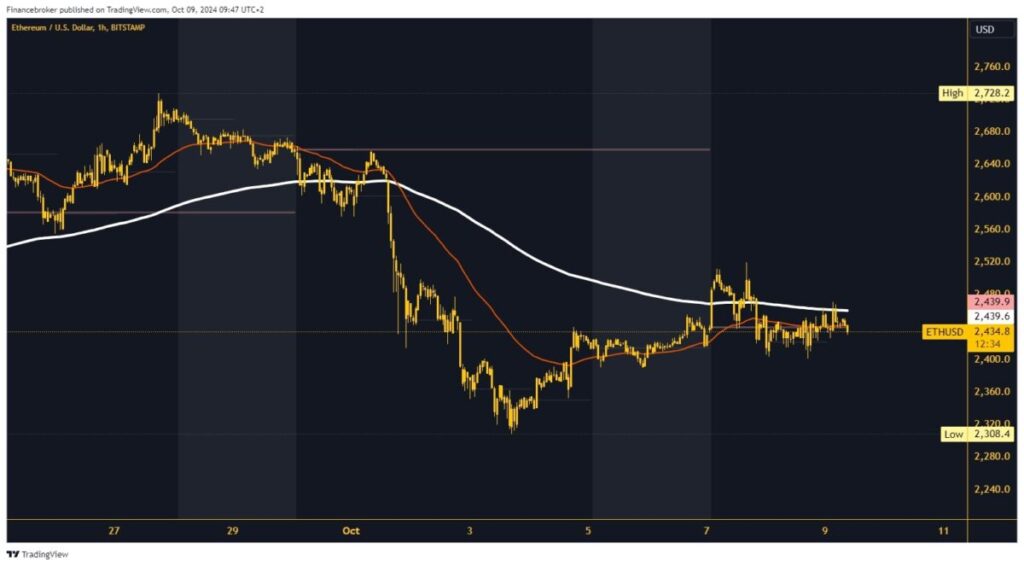
As long as we are below the EMA 200 moving average, the price will be on the bearish side
By moving above the $2440 level, Ethereum climbs above the weekly open level. This could give momentum to the price to take a step above the EMA 200 and climb to a new daily high. With the formation of a new high at the $2480 level, we get confirmation of the strengthening of the bullish momentum. The EMA 200 is now on the bullish side, which strengthens the optimism for a further continuation to a new high.
Potential higher targets are $2500 and $2520 weekly high. The $2500 level holds significant importance for all Ethereum holders and potential buyers. It marks a crucial psychological level that, if breached, could continue the October bullish trend, with the main target set at the September high of $2728.
The post Ethereum is still under pressure from the EMA 200 today appeared first on FinanceBrokerage.